
Constant Currency Reporting: Why Rate Consistency Matters
Introduction: The Hidden FX Distortion in Group Reporting
Month-end pressure builds. The consolidated pack lands. Then the questions start: why is Germany 12% under budget when the country GM swears they hit target?
Here's what's actually happening. The German entity translated its budget at one euro rate, the forecast at another, and the actuals at a third. The 12% miss isn't operational. It's FX noise dressed up as performance data. And in 2024, that noise got loud. According to the U.S. Treasury's June 2025 FX Report, the euro depreciated by 6.3% against the US dollar over the year, while the Japanese yen weakened by 11.2% versus the dollar.
Multi-entity groups routinely compare actuals, budgets and forecasts translated at different rates. Every variance becomes a blend of real performance and currency drift. Constant currency reporting neutralises those FX movements. Finance teams see what actually happened at the operating level, separated from what happened in the FX market.
This guide covers the definition, the calculation mechanics, how to choose the right reference rate, the pitfalls that trap most groups, and how to automate constant currency across a multi-entity consolidation.
What Is Constant Currency Reporting?
Constant currency reporting restates financial results using a consistent set of exchange rates across periods. The purpose is simple: strip out currency movement so the underlying business performance is visible. Same rate, different periods, real comparison.
It sits outside statutory reporting. Deloitte's SEC Reporting Interpretations Manual treats constant currency presentations as non-GAAP financial measures, requiring reconciliations to GAAP. It supplements the statutory numbers. It doesn't replace them.
The mechanics are precise. Guidance from Deloitte DART states that constant currency uses a single exchange rate between periods to remove the effect of FX fluctuations when assessing financial performance. That single rate is applied to both the current and comparative periods. Any remaining variance is operational, not currency-driven.
Where is it applied? Most (Investopedia) commonly to P&L measures: revenue growth, operating income, EBITDA. Some groups extend it to budget-versus-actual comparisons at entity level, which is where it earns its keep for internal management reporting.
Listed multinationals disclose constant currency figures every quarter. TransUnion, ManpowerGroup, Tradeweb. That's the visible use case. The less-visible one is inside private multi-entity groups, where finance controllers use the same discipline to explain variances to boards, lenders and shareholders without the FX cloud obscuring the story.
Any group with subsidiaries reporting in different currencies benefits. If the group runs a budget cycle, a forecast cycle and a monthly close, constant currency is the only way to keep those three data sets talking to each other honestly. The math is straightforward. The governance is where most teams stumble.

Why Comparing Actuals, Budgets and Forecasts at Different Rates Distorts Performance
Budgets get set in September for the year ahead. The FX rate baked in is whatever the market said that day. By March, the forecast is refreshed using a new rate. By July, actuals roll in translated at monthly average rates. Three different rates. One reporting pack. Every variance is contaminated.
Consider the mechanics. A subsidiary in Germany hits its local-currency revenue target exactly. Perfect execution. But between budget-set and reporting date, the euro fell against the dollar. Suddenly the group pack shows a shortfall against budget. The country GM defends numbers that were actually delivered. The CFO questions operational discipline that was actually intact. Everyone is arguing about FX without knowing it.
The reverse is worse. A subsidiary underperforms operationally by 8%. Volume is soft, pricing is weak. But favourable FX translation lifts the reported figure back to budget. The problem hides. No investigation is triggered. The gap compounds quarter over quarter until someone finally strips out the FX and finds it.
And this isn't hypothetical exposure. The June 2025 US Treasury FX Report shows the Chinese renminbi depreciated by 5.6% against the US dollar over 2024, while the Korean won appreciated by 4.3% over the same period. A dollar-reporting group with operations in both regions saw offsetting distortions that netted to something meaningless at the group level while masking two very different local stories.
The common workaround is 'just retranslate the current month'. This understates the problem. Variances compound across year-to-date figures. Forecast rolls carry old rates forward alongside new ones. The distortion doesn't sit in one line. It spreads across every comparative column in the pack.
Rate consistency is the only way out. Apply the same reference rate to budget, forecast and actuals across every period being compared. Then the variance is what it should be: a signal about volume, price and cost, not about the FX market. Anything less is measuring two things (Tradeweb's 2025 results) at once and calling it one number.
How to Calculate Constant Currency: Formula and Worked Example
The formula is simple. The discipline is not.
Constant Currency Value = Local Currency Amount × Chosen Reference Exchange Rate
Three steps get you there. First, select a reference rate. Options include the prior-year average rate, the budget rate, or a fixed base rate held constant across multiple years. Second, apply that same rate to actuals, budget and forecast across every period being compared. Third, compare like-for-like. The variance that survives is operational.
The reference rate choice matters more than most teams admit. Investopedia notes that one common method converts current-period figures using the prior-period average exchange rate, while another restates prior-period figures using the current-year rate. Abylon's guidance describes the same two methods as the Historical Rate Method and the Current Rate Method, each applying the compared period's average FX rate to the other period's figures. Both are valid. Both must be applied consistently.
Underneath all of this sits the statutory translation framework. EY's Financial Reporting Developments confirms that under ASC 830, all assets and liabilities are translated at the balance-sheet date rate, while income-statement elements use transaction-date or average rates. Constant currency reporting is a management layer that sits on top of that statutory translation, not a replacement for it.
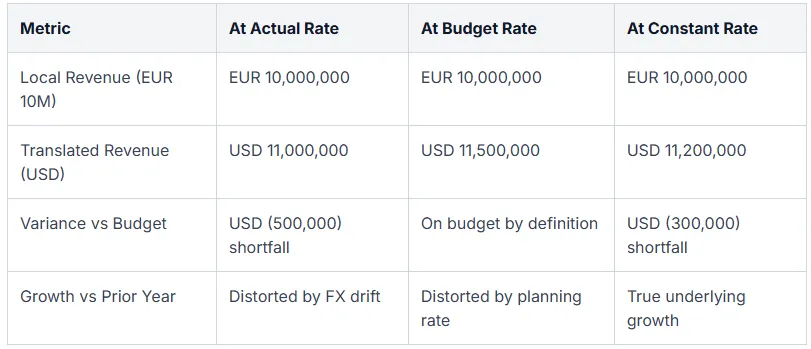
Here is the worked example. A German subsidiary reports EUR 10M in local revenue. The prior-year average rate was 1.10. The budget rate set at planning was 1.15. The chosen constant reference rate is 1.12.
The reported USD figure moves dramatically depending on which rate lands in the pack. Constant currency forces the comparison onto a single ruler.
For deeper practical guidance on selecting between year-to-date rates and monthly averages, our resource centre walks through the mechanics with worked cases.
Which Exchange Rate Should You Use for Constant Currency?
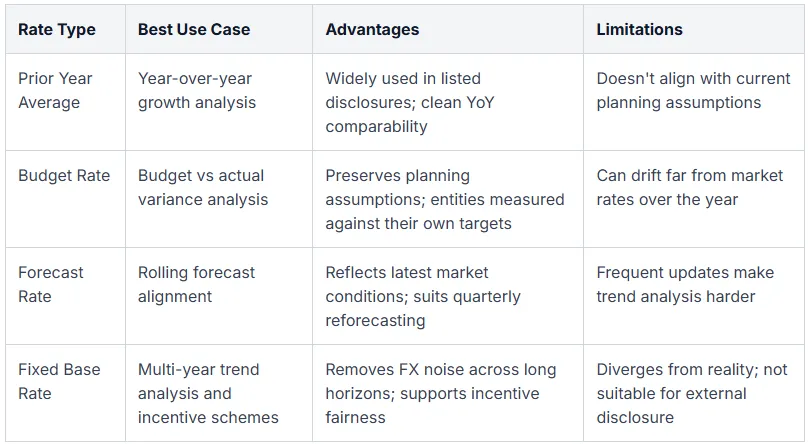
Four reference rates dominate practice. Each solves a different problem.
The prior-year average rate is the workhorse for year-over-year growth analysis. It's the most common choice in listed company disclosures. Deloitte's SEC Reporting Interpretations Manual notes that registrants typically use the prior-period average rate in MD&A to remove the effect of FX fluctuations. It keeps growth comparisons clean without introducing planning assumptions.
The budget rate is the right choice for budget-versus-actual variance analysis. It preserves the planning assumptions the business signed up to. Every entity is measured against the same yardstick they used to build their targets.
The forecast rate comes in when rolling forecasts need to align with the latest actuals. It updates as market conditions shift, which suits businesses that reforecast quarterly.
A fixed base rate, held constant for multiple years, is the workhorse for long-range trend analysis and incentive scheme calculations. It removes FX noise entirely from multi-year comparisons.
ManpowerGroup is a working example of disciplined disclosure. (ManpowerGroup) Its 2025 constant currency schedules show separate columns for reported, constant currency, and organic constant currency revenue and operating profit, with FX impacts quantified in USD. Anyone reading the pack can see exactly where the FX line sits. According to Investopedia, this restatement approach uses a prior-period average rate or current-period rate to eliminate FX volatility in published performance metrics.
Rate governance is where most groups fall short. Document the policy. Pick one method per use case. Apply it consistently across every entity, every period, every consolidation. Disclose the method clearly in the reporting pack. If the rate changes, restate the comparatives. Otherwise the constant currency layer stops being constant, and the whole exercise turns into noise dressed up as insight.
How Constant Currency Fits Into Group Consolidation Workflows
Statutory consolidation and management reporting live under one roof, but they translate the numbers differently. Under IAS 21, balance sheet items are converted at the closing rate. P&L items use the average rate. The gap between those rates lands in the foreign currency translation reserve, or FCTR.
Constant currency is not a replacement for that process. It sits alongside it as a management overlay. The statutory books stay honest to actual rates and audit trails. The management view strips out FX so the operating story is visible.
For multi-entity groups, this means running parallel translations off the same trial balances. One pass applies actual rates for statutory reporting. Another applies constant rates for management analysis. Both feed from the same source, both need to reconcile back to the underlying numbers.
This is where spreadsheets buckle. Dozens of entities, hundreds of accounts, multiple rate sets, and version control that breaks on the second Tuesday of every close. A single rate change ripples across tabs. Someone updates one workbook and forgets the others. The consolidation stops tying.
The cleaner pattern is a single rate table, with every rate tagged by purpose: actual, budget, constant, forecast. Translations happen on demand against the tagged set. No hunting for the right rate. No stale copies. If you're still hand-mapping which exchange rates apply where, our guidance on rates for consolidation walks through the mechanics.

Automating Constant Currency Calculations with Quick Consols
Quick Consols is built for this exact problem. The platform stores unlimited rate sets per period against every entity: actual, budget, forecast, prior year, and any constant rate a finance team wants to hold. Nothing is hard-coded. Nothing is buried in a formula three tabs deep.
Actuals, budgets and forecasts retranslate on demand using any stored rate set. Want to see the current quarter through prior-year rates? One click. Want to test the budget against a stress-case rate? Same click, different rate set. The constant currency view is not a separate model. It is the same consolidation, seen through a different lens.
Variance reports go a step further. Movement decomposes automatically into volume, price and FX components. Finance teams stop arguing about whether growth was real. The FX line is quantified. The operating line is clean. The audit committee sees both.
Trial balances flow in from Xero, QuickBooks, Sage and other ERPs, so the rate engine works off live source data rather than exported CSVs stitched together at month-end. The fragile chain of VLOOKUPs, rate lookup tabs and manual restatements disappears. So do the errors that live inside them.
If your group is still rebuilding constant currency logic in spreadsheets every quarter, our Financial Reporting & Group Consolidation Software handles the translation, tagging and reconciliation in one place.
Frequently Asked Questions
Is constant currency reporting GAAP compliant?
Constant currency is classified as a non-GAAP financial measure. It supplements statutory reporting but does not replace it. When disclosed externally, it requires reconciliation to the reported GAAP or IFRS figures, and the methodology used must be transparent. Internally, groups use it freely for management analysis without those disclosure obligations.
What is the difference between constant currency and functional currency?
Functional currency is the primary economic environment in which an entity operates, defined under IAS 21. It drives statutory translation. Constant currency is a management reporting technique that applies a fixed rate across periods to strip out FX noise. Functional currency is an accounting determination. Constant currency is an analytical choice.
Which exchange rate should we use for constant currency reporting?
The prior-year average rate is standard for year-on-year comparisons. The budget rate is common for variance analysis against plan. What matters most is consistency. Whatever rate is chosen must apply to actuals, budget and forecast alike, otherwise the comparison stops being like-for-like and the analysis loses its value.
Does constant currency reporting apply to the balance sheet?
Constant currency is primarily a P&L and KPI tool, applied to revenue, operating profit, EBITDA and similar measures. Balance sheet items stay translated at closing rates under IAS 21 for statutory purposes. Some groups do extend constant currency to working capital metrics like receivables days, but the balance sheet itself is rarely restated on a constant basis.
How does constant currency reporting work in hyperinflationary economies?
Hyperinflationary subsidiaries are first restated for inflation under IAS 29 before translation, which complicates any constant currency overlay. Most groups either exclude hyperinflationary entities from the constant currency view entirely, or apply a specific treatment disclosed in the notes. Mixing them in without adjustment distorts the comparability that constant currency is meant to provide.
Can constant currency calculations be automated across multiple entities?
Yes. Consolidation platforms that store multiple rate sets per period can retranslate trial balances on demand across every entity in the group. This eliminates the manual spreadsheet chain and enforces rate consistency automatically. Finance teams get instant constant currency views without rebuilding the model each close.
See Constant Currency Reporting in Action
FX distortion is a solvable problem. The tools finance teams use to solve it should not be the source of the next problem.
Quick Consols removes the FX noise from actual, budget and forecast comparisons automatically. Every entity, every rate set, every period. No manual restatements. No broken VLOOKUPs. No last-minute scramble to explain why the reported number and the operating number tell different stories.
Groups running Xero, QuickBooks, Sage or a mix of ERPs feed straight into the platform. Trial balances translate on demand, variance reports decompose FX from operating movement, and the audit trail stays intact.
Book a demo to see multi-rate translation running across a real group in real time, and explore Financial Analytics & Reporting to see how the constant currency view sits alongside your statutory close. Bring your own rate scenarios. Bring your own trial balances if you'd like. The point of the demo is to see the mechanics on your data, not a sanitised sample.

Share this Article


Get in Touch
If you have any questions about our Consolidation Software, send us a message below and we'll get back to you ASAP.
Read this next
.webp)